Event Search
Menu: SIEM → Event Search Best for: Operators + Analysts Event Search lets you query raw SIEM events directly from the Wazuh Indexer across any configured Event Source. Use it for investigation, threat hunting, and validating detection coverage.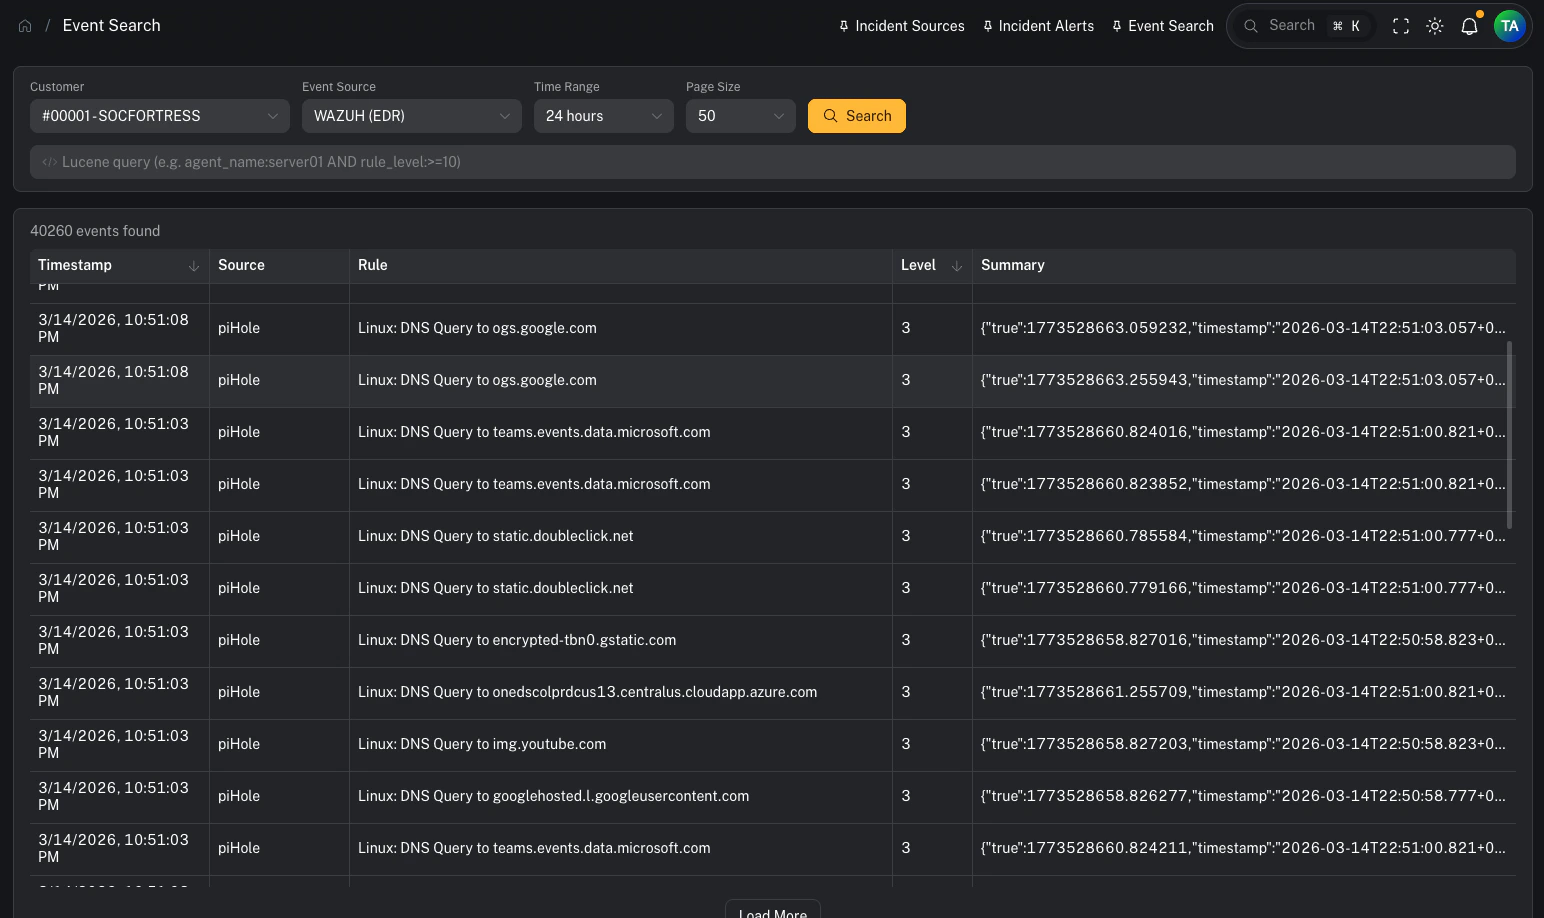
Prerequisites
Before using Event Search, a customer must have at least one Event Source configured. If no Event Sources exist for the selected customer, a warning banner will appear with instructions. See: Event Sources for setup instructions.Step 1 — Select a customer and event source
Use the filter bar at the top to select:- Customer — the tenant whose data you want to query
- Event Source — the specific data source (e.g. Wazuh EDR, Office 365 Logs)
- Time Range — how far back to search (1 hour to 30 days)
- Page Size — number of results per page (25–250)
Step 2 — Write a Lucene query (optional)
The search bar supports full Lucene query syntax. If left empty, all events in the time range are returned. Example queries:| Query | What it finds |
|---|---|
agent_name:web-server-01 | Events from a specific agent |
rule_level:>=10 | High-severity alerts (level 10+) |
agent_name:dc01 AND rule_level:>=8 | Combined filters |
rule_description:"brute force" | Phrase match in rule description |
NOT agent_name:test-* | Exclude test agents |
Field name autocomplete
As you type a field name, an autocomplete dropdown appears showing matching field names from the selected index. Press Tab to accept a suggestion.Step 3 — Review results
Results appear in a sortable table with these columns:| Column | Description |
|---|---|
| Timestamp | When the event occurred |
| Source | The agent or source that generated the event |
| Rule | The rule description or ID that triggered |
| Level | Severity level (color-coded: red ≥12, orange ≥8, blue ≥4) |
| Summary | The full log message or event data |
Loading more results
If more events exist beyond the current page, a Load More button appears below the table. Click it to fetch the next batch of results.Step 4 — Inspect event details
Clicking a row opens a side drawer showing every field in the event, sorted alphabetically.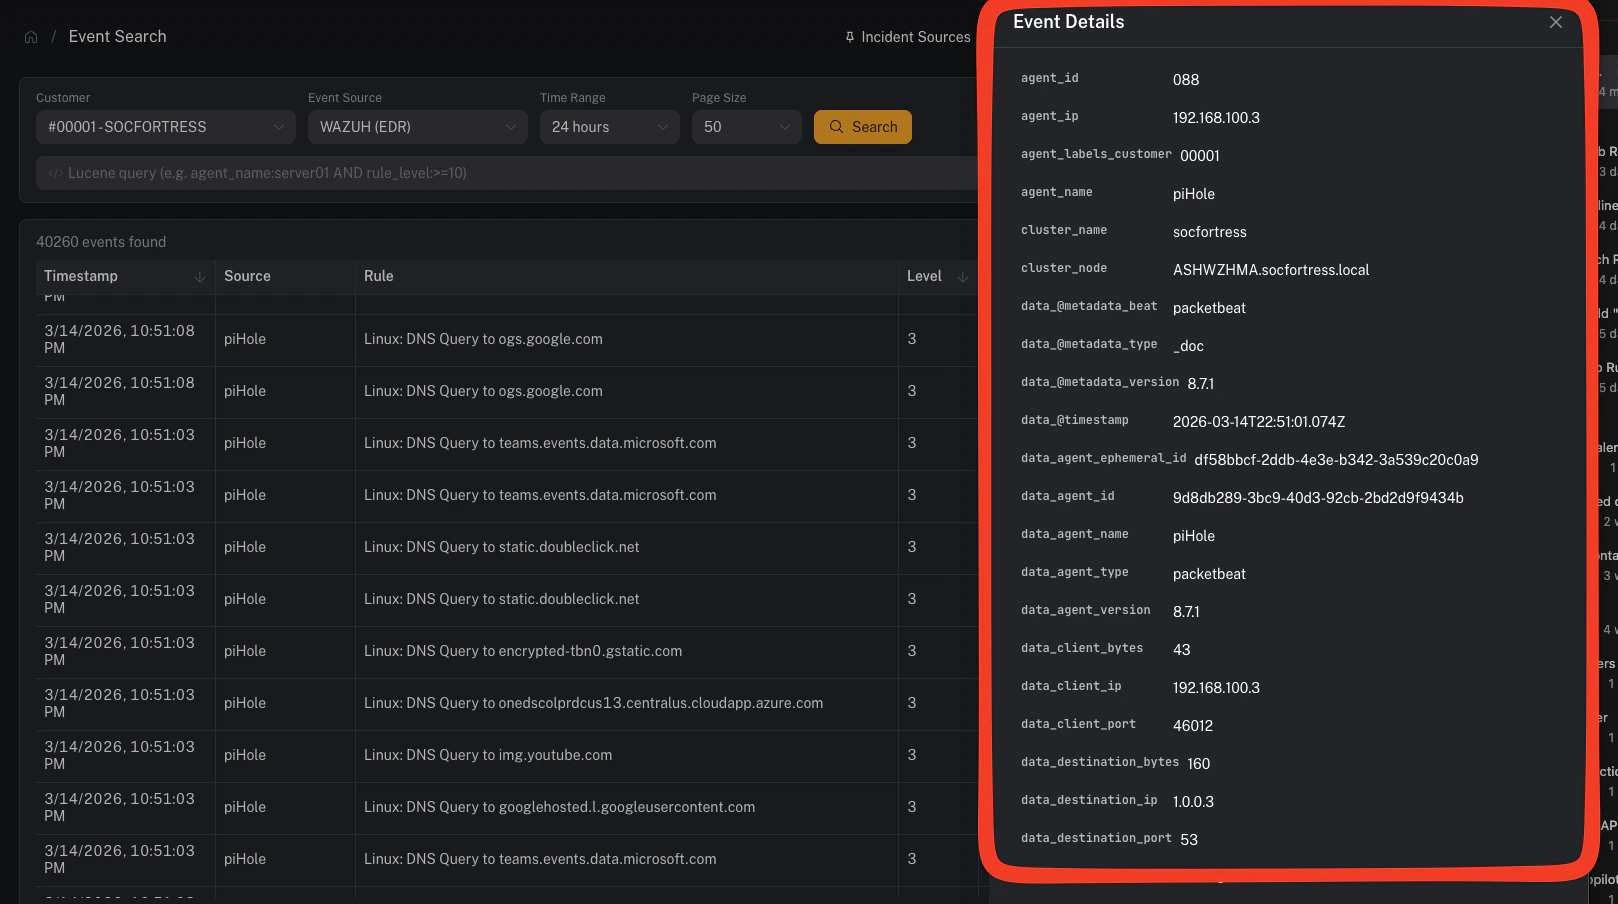
Filter from the detail drawer
Hover over any field to reveal two action buttons:- Filter (+) — adds
field:"value"to your query and re-runs the search - Exclude (−) — adds
NOT field:"value"and re-runs the search
Deep-linking from Incident Management
When viewing an alert asset in Incident Management → Alerts, thealert_linked field includes a “View in Event Search” link. Clicking it opens Event Search in a new tab with the customer, default EDR source, and Lucene query pre-populated to find the specific alert.
Tips
- Broad first, then narrow: Start with a wide time range and no query, then use the detail drawer’s filter buttons to progressively refine.
- Use wildcards sparingly: Lucene supports
*and?wildcards in values, but leading wildcards (e.g.*server) are expensive — avoid them on large indexes. - Check the time range: If you’re not finding expected events, try expanding the time range — the default is 24 hours.
- Bookmark queries: The URL contains query parameters (
customer_code,source_name,query), so you can bookmark or share a specific search.
Related pages
- Event Sources — configure which indexes to search per customer
- SIEM Alerts — high-level alert summaries from Graylog
- MITRE ATT&CK — technique-centric alert view
- Incident Alerts — the analyst investigation queue