Healthcheck (InfluxDB + Telegraf)
Menu: Healthcheck Best for: Admin / Engineer (primary) + Operator (awareness) CoPilot’s Healthcheck ties into InfluxDB to surface health signals collected by Telegraf. Typical signals include:- CPU consumption
- memory consumption
- disk space utilization
How it works (high level)
- Telegraf runs on endpoints/servers and collects metrics (cpu/mem/disk)
- Metrics land in InfluxDB (CoPilot queries the InfluxDB
_monitoringbucket) - Health checks and thresholds create alert states (ok/info/warn/crit)
- CoPilot displays the resulting alerts in the Healthcheck UI
What you can do in CoPilot
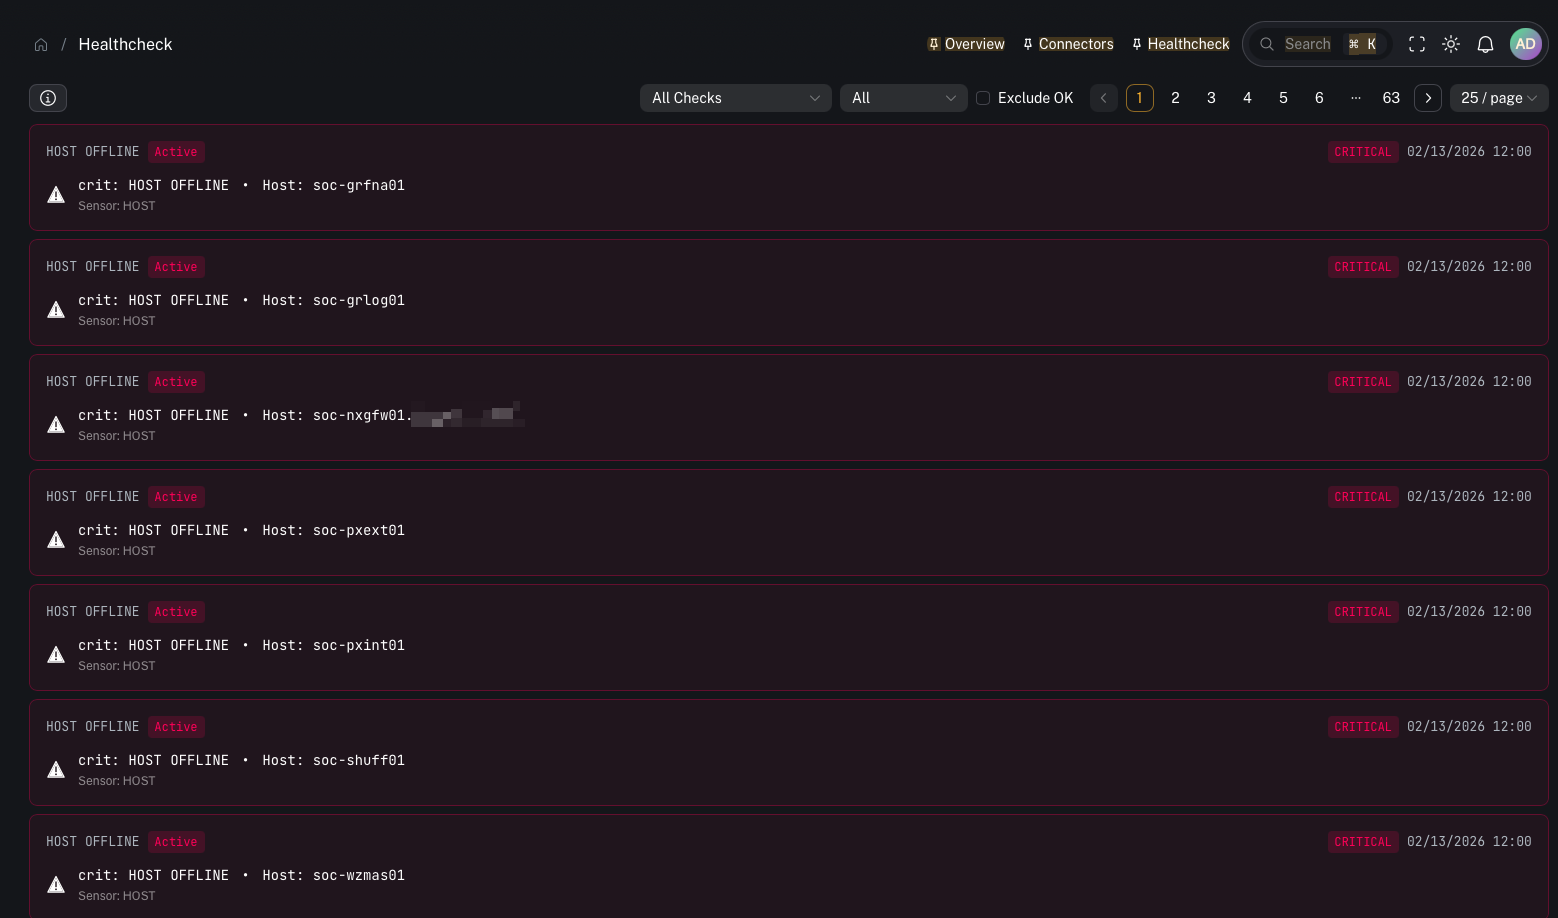
Review active alerts
- what is currently broken / at risk
- which systems are trending toward failure
Triage by severity
Healthcheck alerts are categorized by severity (for example: Critical, Warning, Info, Ok).
What to monitor (recommended)
CPU
- sustained high CPU on Graylog/Wazuh components can cause ingestion/alerting lag
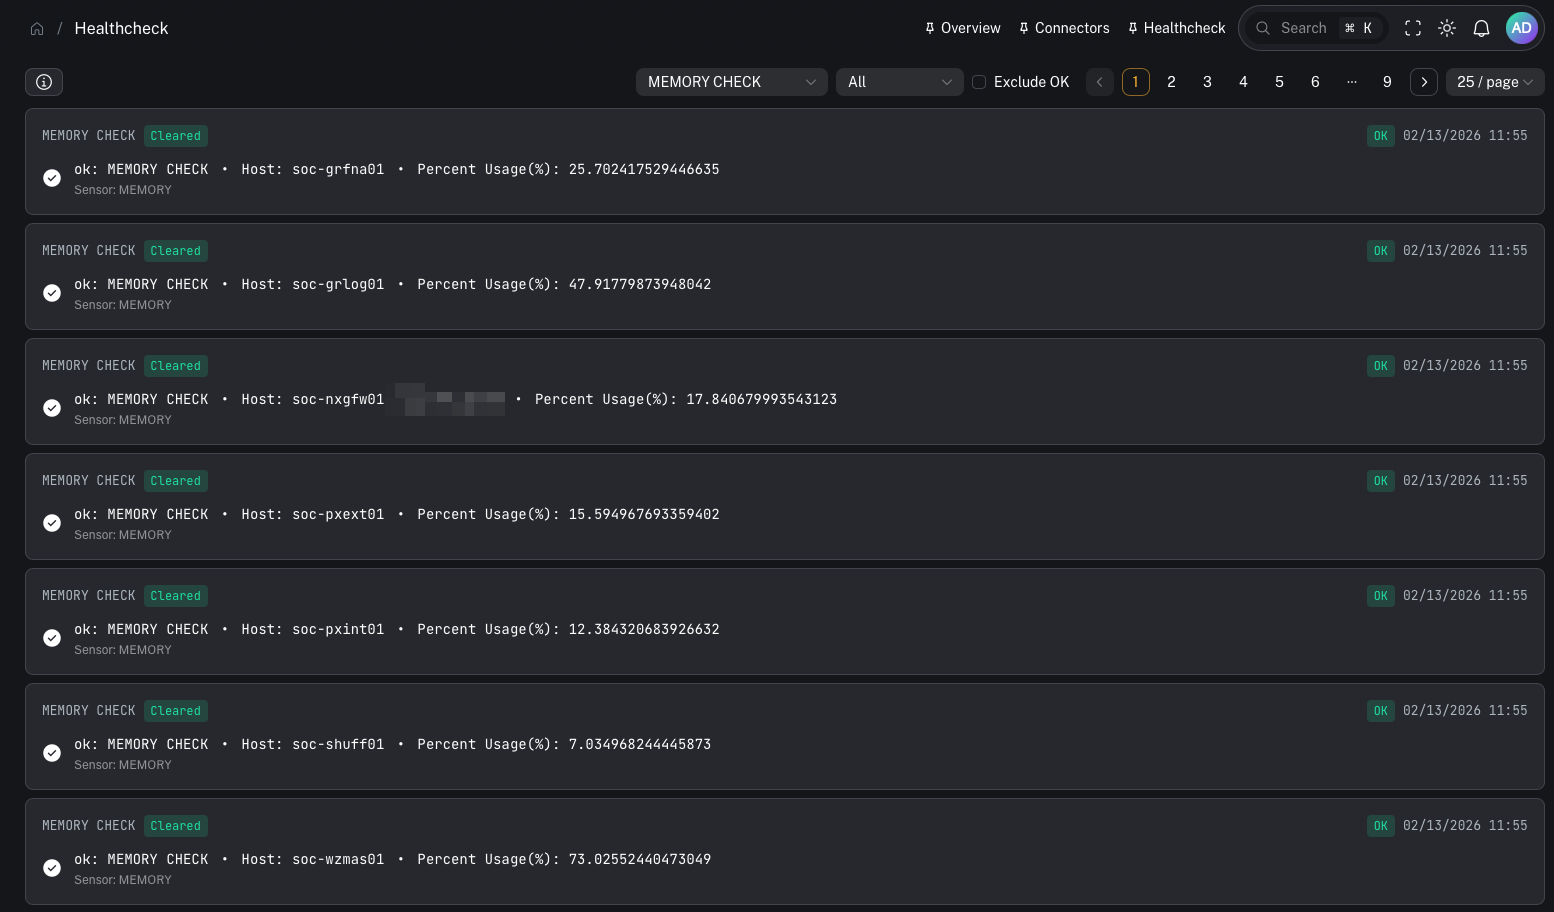
Memory
- memory pressure can lead to OOM kills and unstable services
Disk
- disk thresholds are the most common SIEM failure mode (indexes stop accepting writes)
Practical runbook (when something trips)
- Identify what triggered (disk vs cpu vs mem)
- Identify the system/host
- Decide whether this is:
- a transient spike
- a sustained capacity issue
- a misconfiguration (wrong retention / noisy ingestion)
- Take action:
- disk: snapshot/restore + retention tuning + index cleanup
- cpu/mem: scale resources, tune ingestion, investigate heavy queries
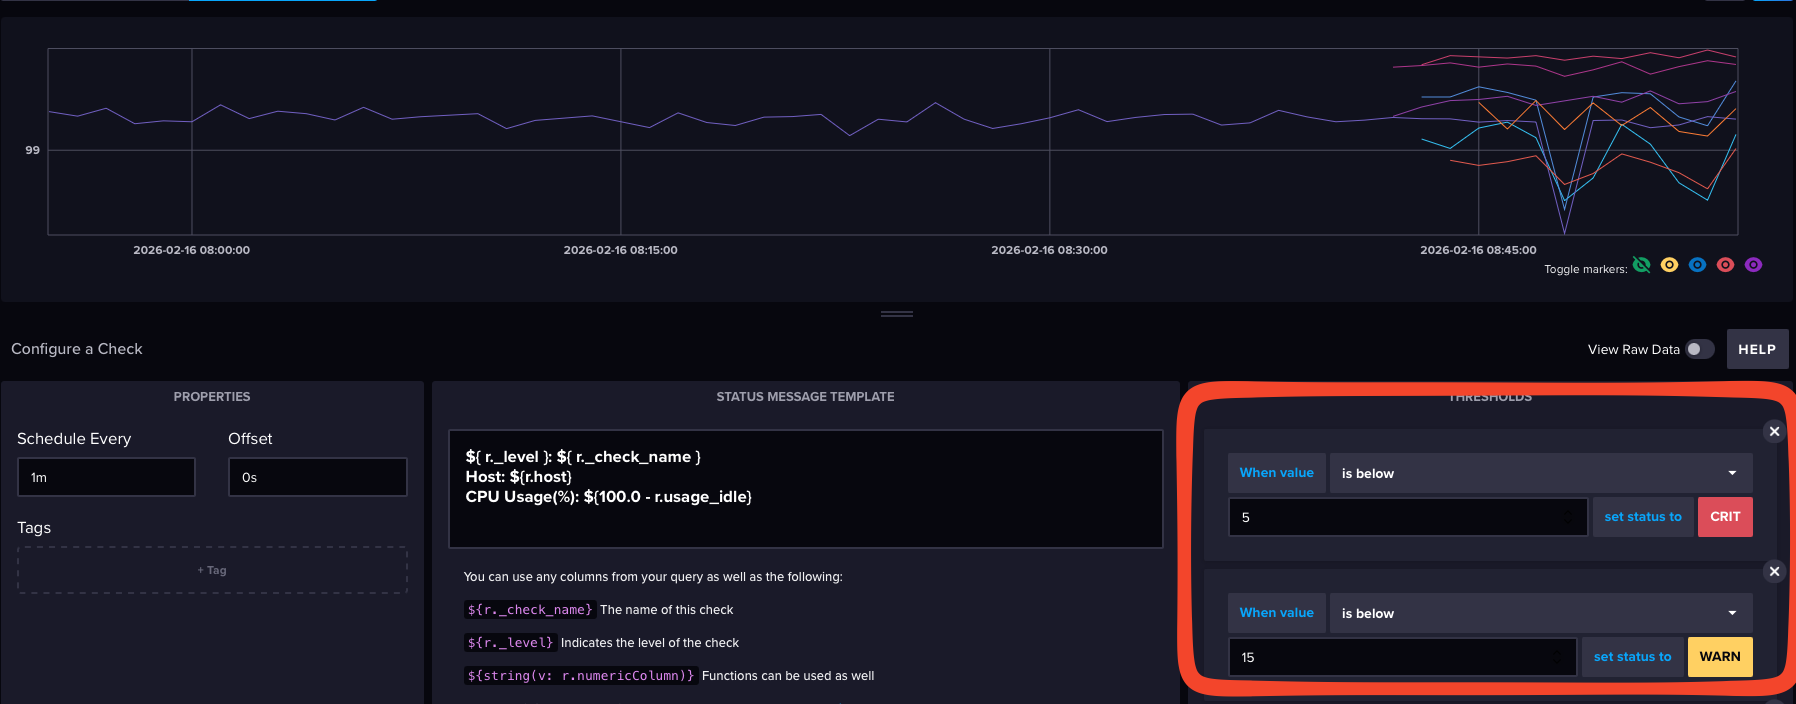
Advanced: check names and thresholds
Depending on your deployment, Influx may expose many checks.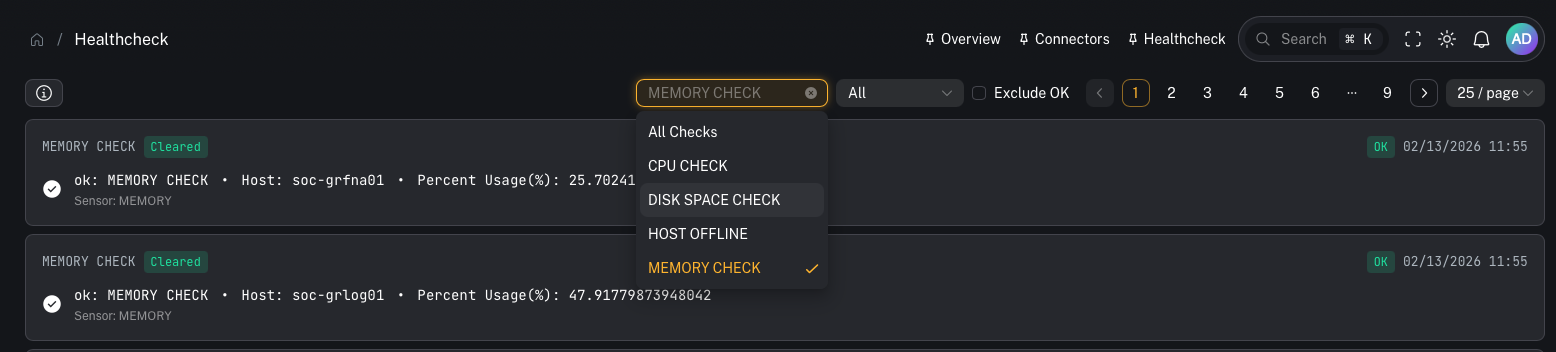
Common gotchas
“Healthcheck is empty”
Common causes:- Telegraf isn’t deployed or isn’t shipping metrics
- InfluxDB connector isn’t configured in CoPilot
- wrong org/bucket configuration (CoPilot expects
_monitoring)