
Navigation Guide (UI Map + Tips)
This page explains what each left-hand navigation item in CoPilot does and how to use the UI efficiently.Source of truth:frontend/src/app-layouts/common/Navbar/items.tsxand the section files underNavbar/items/(menu), andfrontend/src/router/routes/(routes).
How the menu is organised
The sidebar follows the order SOC work happens in:
The avatar menu (top right) holds only what’s about you: Profile, Documentation, Contact SOCFortress and Logout.
- Deep links (useful for bookmarks and SOPs):
- Incident alerts open directly via
?alert_id=<id> - Incident cases open directly via
?case_id=<id> - Customers supports
?code=<customer_code>and?action=add-customer - Graylog Management supports tab anchors such as
#streamsand#inputs
- Incident alerts open directly via
”Where do I start?” by role
SOC operator / analyst
- Incidents → Alerts (
/incident-management/alerts): the triage queue - Incidents → Cases (
/incident-management/cases) - AI Analyst (
/ai-analyst): AI-powered investigation, reports and Talon chat - Investigate → Event Search (
/event-search) when an alert needs more context
Admin / engineer
- Platform → Connectors & Integrations → Connectors (
/connectors): connect Wazuh, Graylog, Grafana, Velociraptor and the rest - Platform → Connectors & Integrations → Integrations (
/external-services/third-party-integrations): per-customer third-party sources - Platform → Log Management → Index Management (
/indices/management): index health and troubleshooting - Platform → Log Management → Graylog Management (
/graylog/management): streams, inputs, provisioning
Screenshots
From a lab environment, to help you recognise where you are:-
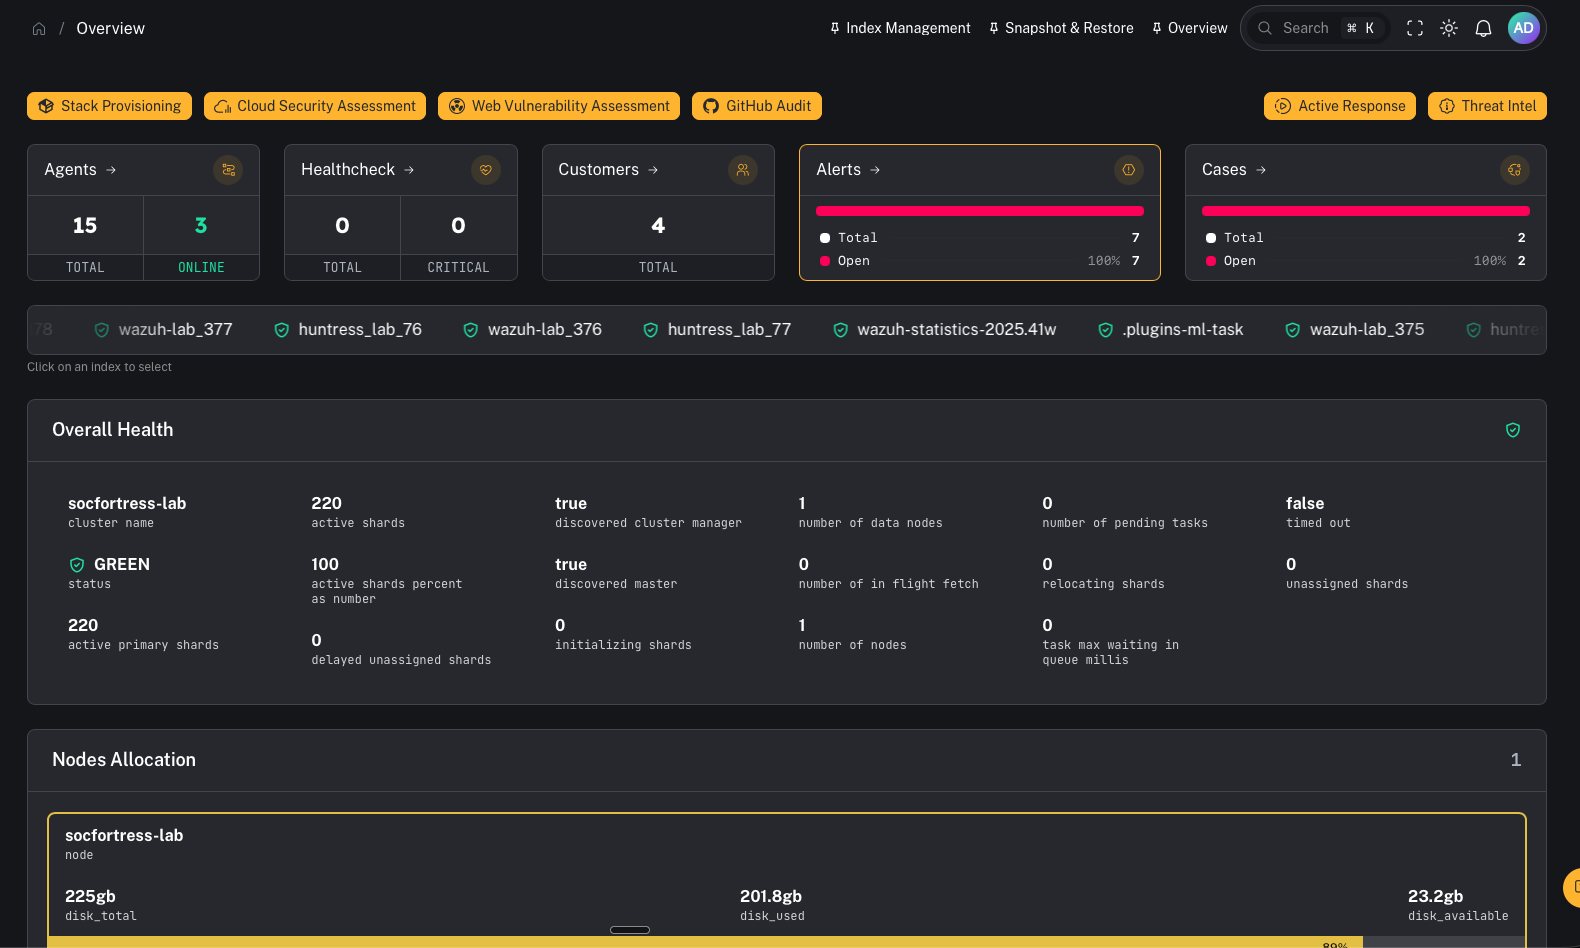
Overview:
-
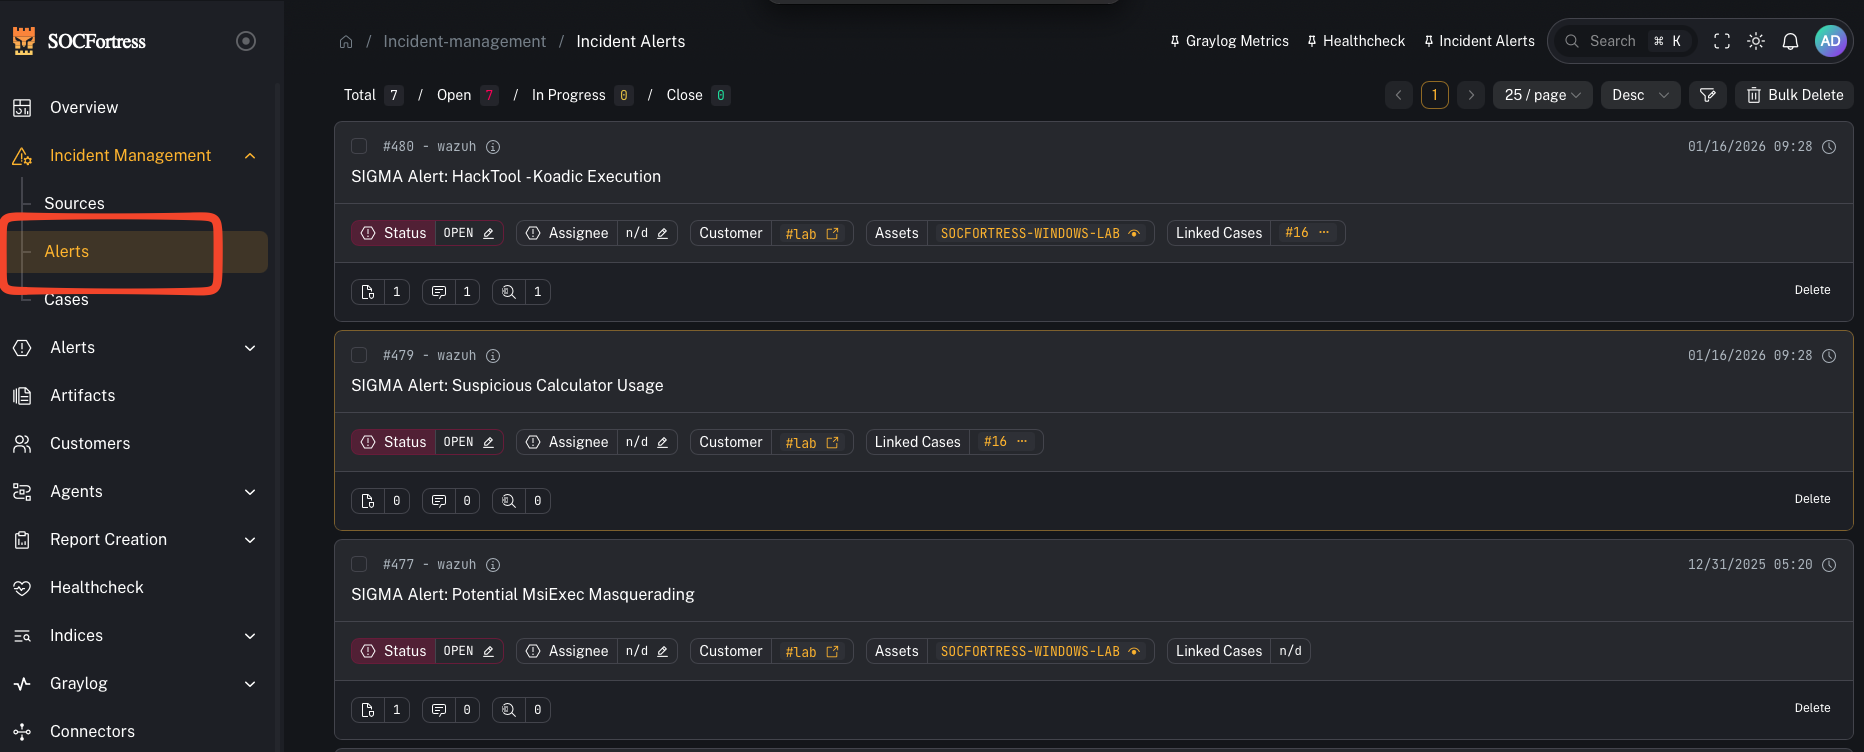
Incidents → Alerts:
-
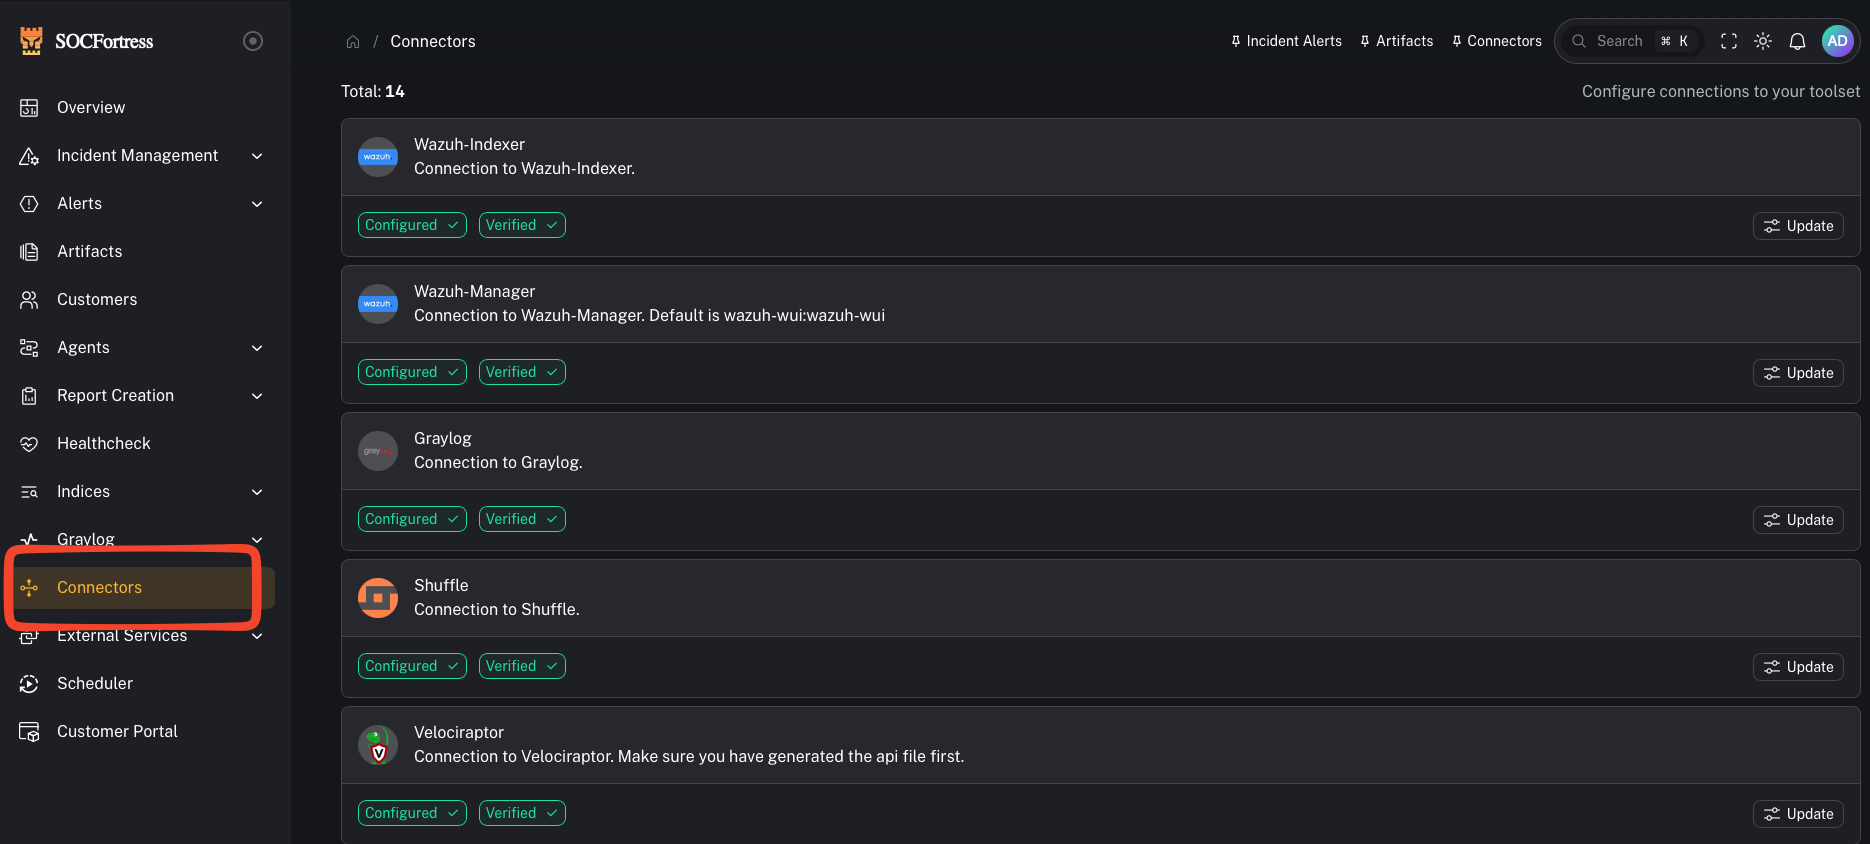
Platform → Connectors & Integrations → Connectors:
-
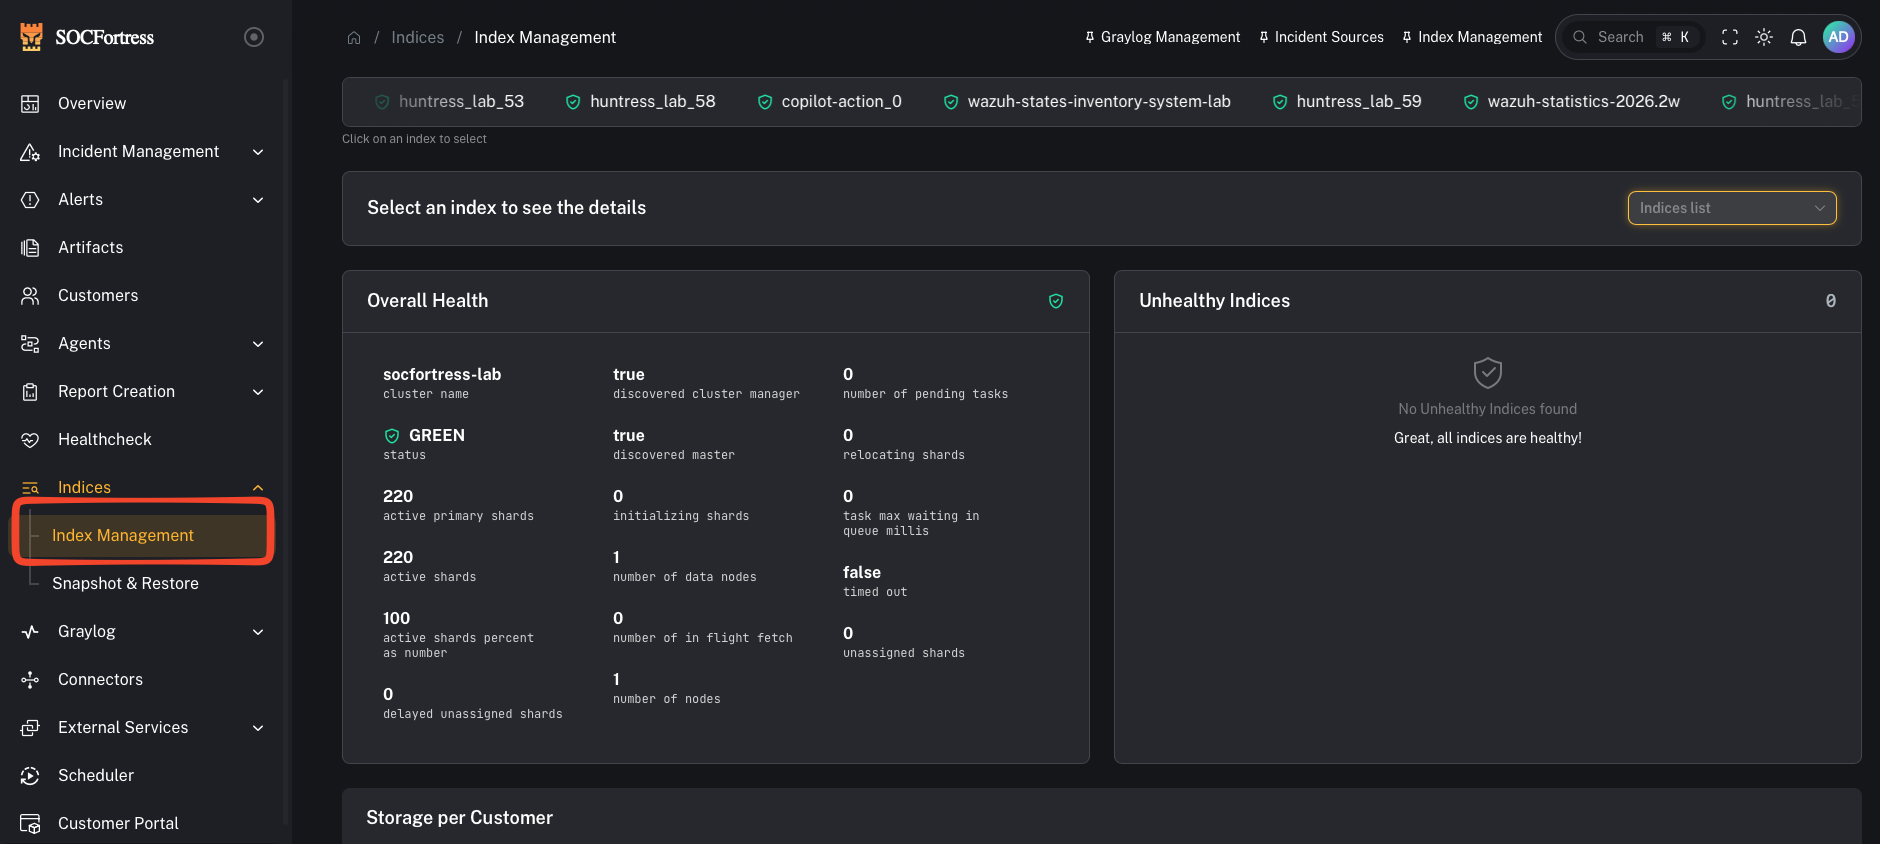
Platform → Log Management → Index Management:
-
Platform → Log Management → Graylog Management:
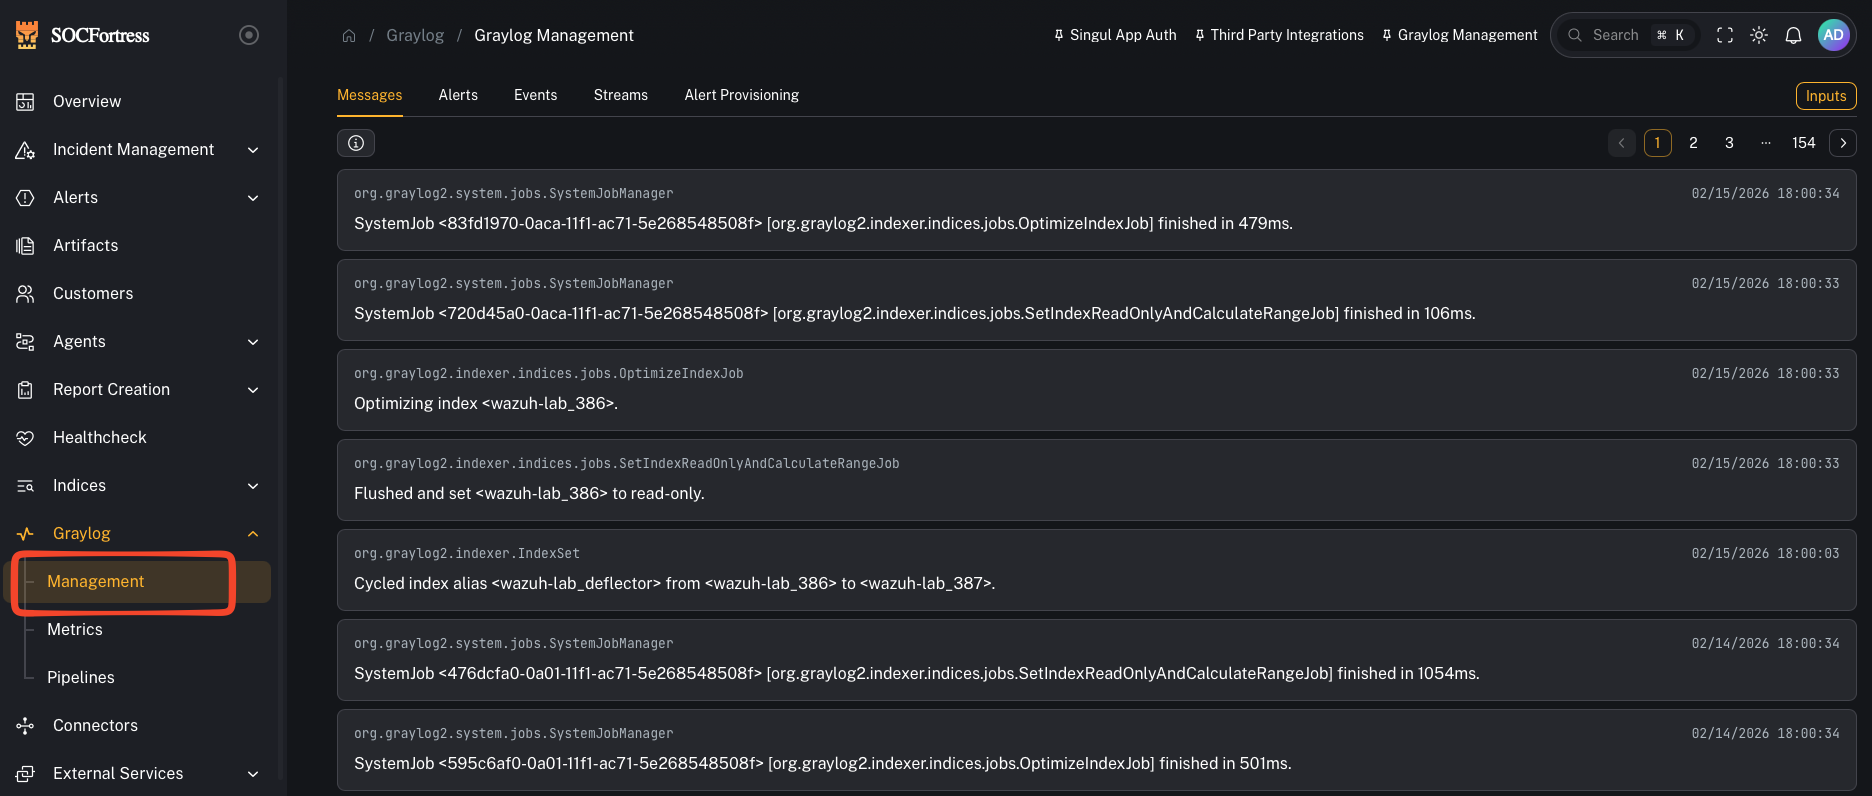
Left navigation map (what each item does)
Overview
- Overview →
/overview- The landing dashboard once logged in.
AI Analyst
- AI Analyst →
/ai-analyst- AI-powered investigation hub: Talon chat, alert reports and architecture overview.
Incidents
- Incidents → Alert Sources & Exclusions →
/incident-management/sources- Which SIEM alerts get ingested as incidents, and the exclusion rules that suppress them. Define a source first: until one exists, nothing reaches the triage queue.
- Incidents → Alerts →
/incident-management/alerts- The primary triage queue.
- Deep link:
/incident-management/alerts?alert_id=<id>
- Incidents → Cases →
/incident-management/cases- Investigation lifecycle management.
- Deep link:
/incident-management/cases?case_id=<id>
- Incidents → Case Templates →
/incident-management/case-templates
Investigate
- Investigate → Event Search →
/event-search- Search and filter raw events.
- Investigate → SIEM Alerts →
/alerts/siem- Raw alerts from the SIEM indices (Graylog-backed). Not the triage queue: that’s Incidents → Alerts.
- Investigate → Dashboards →
/dashboards - Investigate → File Analysis →
/file-analysis - Investigate → Threat Intel →
/threat-intel- One tab per source, selected with
?tab=:- SOCFortress (
?tab=socfortress): reputation lookup for an IP, domain or SHA256 hash. - VirusTotal (
?tab=virustotal): submit a file for analysis. The upload is shared with VirusTotal. - OpenCTI (
?tab=opencti): IOC lookup, and a filterable indicators table (&view=indicators). Only shown once the OpenCTI connector is verified. The old/openctiURL redirects here.
- SOCFortress (
- The quick-access Threat Intel button on the Overview page and the SIEM alert lists still opens the same lookups in a side panel, so you don’t have to leave the page.
- One tab per source, selected with
Respond
- Respond → Active Response: opens the active response wizard.
- Respond → Artifacts →
/artifacts- Velociraptor collection, commands and quarantine.
- Respond → CoPilot Actions →
/agents/copilot-actions
Detections
- Detections → Catalog →
/detection-catalog- Browse CoPilot Searches by story, the full Wazuh ruleset, coverage gaps and compliance mappings.
- Detections → CoPilot Searches →
/copilot-searches - Detections → Wazuh Rules →
/agents/detection-rules- The Wazuh rule-file editor (formerly Agents → Detection Rules).
- Detections → MITRE ATT&CK →
/alerts/mitre - Detections → Atomic Red Team →
/alerts/atomic-red-team- Adversary simulation / test harness.
Exposure
- Exposure → Vulnerabilities →
/agents/vulnerability-overview - Exposure → Patch Tuesday →
/patch-tuesday - Exposure → Configuration Assessment → SCA Overview →
/agents/sca-overview - Exposure → Configuration Assessment → SCA Policies →
/agents/sca-policies - Exposure → Cloud Security Assessment →
/cloud-security-assessment - Exposure → Web Vulnerability Assessment →
/web-vulnerability-assessment - Exposure → GitHub Audit →
/github-audit
Endpoints
- Endpoints → Agents →
/agents - Endpoints → Agent Groups →
/agents/groups - Endpoints → Sysmon Config →
/agents/sysmon-config
Customers
- Customers →
/customers- Multi-tenant / customer context management.
- Deep links:
/customers?code=<customer_code>,/customers?action=add-customer
Reports
- Reports → General Reports →
/report-creation/general - Reports → Vulnerability Reports →
/report-creation/vulnerability-reports - Reports → SCA Reports →
/report-creation/sca-reports
Platform
Visible to analysts as well as admins. The items marked (admin only) are hidden from analysts.- Connectors & Integrations
- Connectors →
/connectors: configure and verify connections to the stack services - Integrations →
/external-services/third-party-integrations - Network Connectors →
/external-services/network-connectors - Shuffle App Auth →
/external-services/shuffle-app-auth
- Connectors →
- Notifications (admin only)
- Internal Routes →
/internal-notifications - Message Templates →
/message-templates
- Internal Routes →
- Log Management
- Index Management →
/indices/management(deep link:?index_name=<name>) - Snapshot & Restore →
/indices/snapshots - Graylog Management →
/graylog/management(tab anchors:#streams,#inputs,#events) - Graylog Metrics →
/graylog/metrics - Graylog Pipelines →
/graylog/pipelines(jump to a rule with?rule=<name>)
- Index Management →
- Health
- Healthcheck Alerts →
/healthcheck/alerts - Metrics →
/healthcheck/metrics
- Healthcheck Alerts →
- Access
- Users →
/users - SSO →
/sso-config(admin only) - Audit Log →
/audit(admin only)
- Users →
- System
- Scheduler →
/scheduler - Logs →
/logs - License →
/license - Stack Provisioning: opens the stack provisioning wizard
- Customer Portal →
/customer-portal
- Scheduler →
Avatar menu (top right)
- Profile →
/profile - Documentation → docs.socfortress.co (external)
- Contact SOCFortress → socfortress.co/contact-us (external)
- Logout
Suggested mental model (helps teams onboard)
- Operators live in Incidents, AI Analyst and Investigate. Select a customer in the sidebar filter first, then triage.
- Detection engineers work in Detections (and Endpoints → Sysmon Config), with Platform → System → Scheduler for scheduled jobs.
- Admins / engineers spend their time in Platform: connectors and integrations, log management and health.