> ## Documentation Index
> Fetch the complete documentation index at: https://docs.socfortress.co/llms.txt
> Use this file to discover all available pages before exploring further.
# SOC Management
> How fast the SOC responds and resolves, against the SLA promised to each customer — per severity, analyst, rule and customer.
# SOC Management
**Menu:** SOC Management (top of the sidebar)
**Best for:** SOC managers, team leads, admins — and analysts, for their own figures
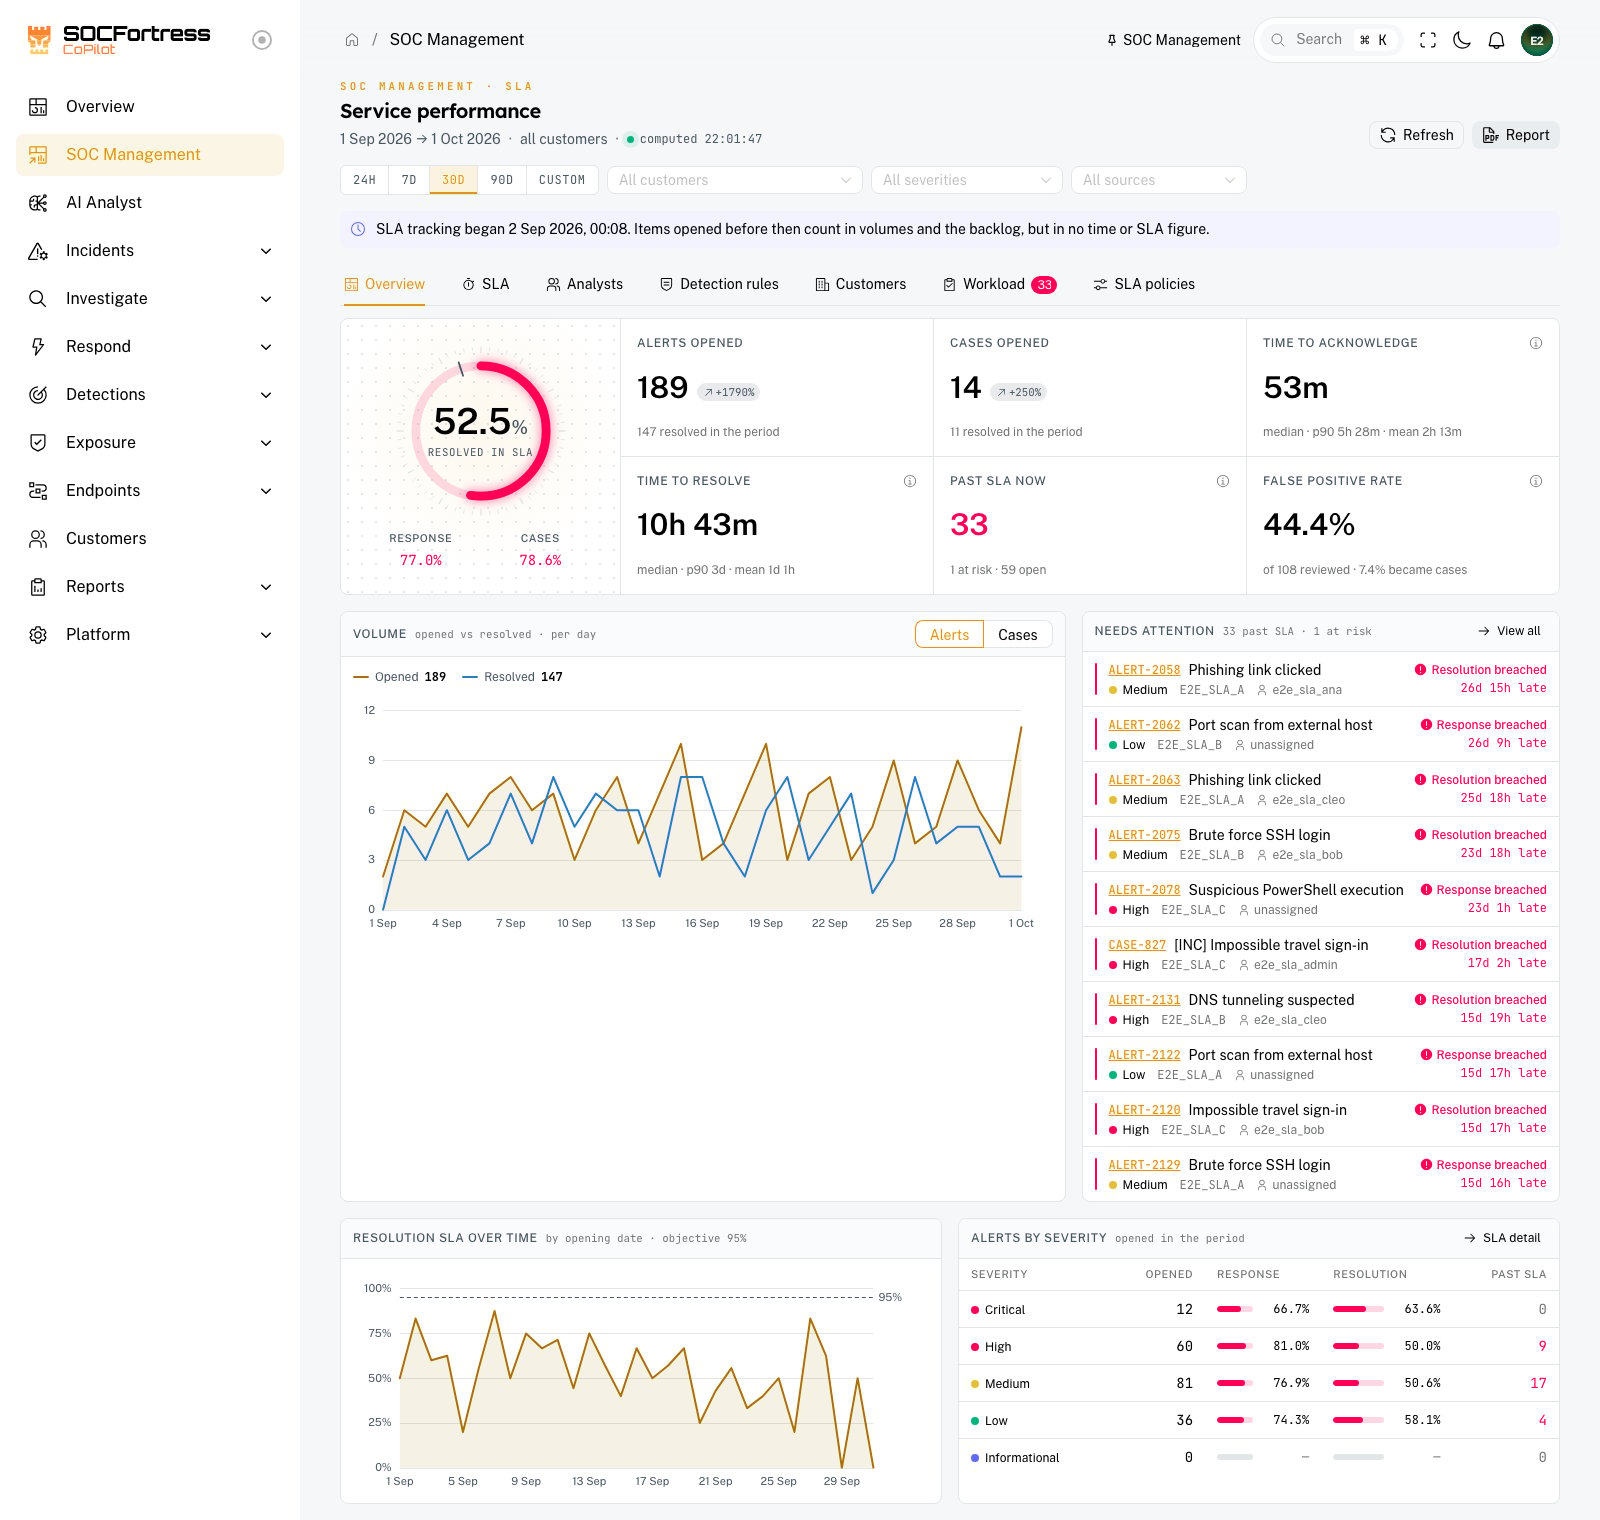 SOC Management answers the questions a SOC is judged on: **how fast did we respond, how fast did we resolve, did we keep the promise we made to each customer, and what is about to slip?** Every figure comes from the alerts and cases in Incident Management — there is nothing to feed it by hand.
The targets it measures against are the **SLA policies** — see [SLA policies and business hours](./sla-policies.md).
***
## The two clocks
Every alert and case runs two clocks from the moment it reaches CoPilot:
| Clock | Stops when | Counts as a response |
| - | - | - |
| **Response** (time to acknowledge) | The SOC first acts on the item | assigning it, changing its status, commenting, setting a verdict, escalating, linking it to a case, changing a case's severity |
| **Resolution** (time to resolve) | The item is closed | — |
Two rules that matter when reading the numbers:
* **Only the SOC acknowledges.** A customer commenting on their own alert in the portal, or automation writing to it, does not stop the response clock — the clock measures *your* response. A customer *closing* an item does resolve it; those closures are reported apart.
* **Waiting on the customer stops both clocks.** Set an alert or case to **Waiting on customer** when you need something from them (a confirmation, a log, a decision). The clocks stop until the item moves on — the customer's reply in the portal hands it back to you automatically (it returns to *In progress*). The wait is never counted against the SOC.
SOC Management answers the questions a SOC is judged on: **how fast did we respond, how fast did we resolve, did we keep the promise we made to each customer, and what is about to slip?** Every figure comes from the alerts and cases in Incident Management — there is nothing to feed it by hand.
The targets it measures against are the **SLA policies** — see [SLA policies and business hours](./sla-policies.md).
***
## The two clocks
Every alert and case runs two clocks from the moment it reaches CoPilot:
| Clock | Stops when | Counts as a response |
| - | - | - |
| **Response** (time to acknowledge) | The SOC first acts on the item | assigning it, changing its status, commenting, setting a verdict, escalating, linking it to a case, changing a case's severity |
| **Resolution** (time to resolve) | The item is closed | — |
Two rules that matter when reading the numbers:
* **Only the SOC acknowledges.** A customer commenting on their own alert in the portal, or automation writing to it, does not stop the response clock — the clock measures *your* response. A customer *closing* an item does resolve it; those closures are reported apart.
* **Waiting on the customer stops both clocks.** Set an alert or case to **Waiting on customer** when you need something from them (a confirmation, a log, a decision). The clocks stop until the item moves on — the customer's reply in the portal hands it back to you automatically (it returns to *In progress*). The wait is never counted against the SOC.
 Every alert and case page shows its own clocks in the **Service level** panel: time used against the target, who stopped each clock, and whether it is waiting on the customer.
***
## How the figures are computed
* **Compliance = met ÷ (met + breached).** Items still running have no outcome yet and are left out of both sides. "No outcome yet" shows as **—**, never as 0% or 100%.
* **Times are medians.** One bulk close of old noise can move an average by days; the median does not. The mean and the 90th percentile are shown next to it for the tail.
* **"Past SLA now"** counts open items whose clock has run out *and is still running*. A late acknowledgement stays a breach in the compliance figures, but it is not something to chase anymore.
* **Every tab is one snapshot.** All tabs, the attention list and the PDF report are computed together, so they never disagree.
* **Items opened before SLA tracking began** (the upgrade that introduced this page) count in volumes and in the backlog, but in no time or compliance figure — a banner says from when tracking runs.
***
## Filters
At the top: the **period** (24 hours, 7, 30 or 90 days, or a custom range), **customers**, **severities** and **sources**. Filters and the current tab live in the URL, so a link you share opens the same view.
You only ever see what your access allows: customer assignments and tag-based access apply exactly as in the alert and case lists.
***
## Tabs
| Tab | What it shows |
| - | - |
| **Overview** | The headline: SLA compliance, volumes opened/resolved with the change against the previous period, median times, past SLA now, false-positive rate, the volume trend and the items that need attention |
| **SLA** | Response and resolution compliance per severity, target against actual, and resolution compliance over time |
| **Analysts** | Per analyst: items acknowledged and resolved, their times, SLA kept, current load. **Admins see every analyst; an analyst sees only their own row.** |
| **Detection rules** | The rules producing alerts, how many became cases, how many were false positives — noisy rules are flagged for tuning |
| **Customers** | Per customer: volumes, backlog, past SLA, times and compliance |
| **Workload** | The live backlog: open, unassigned (and since when), at risk, past SLA, **waiting on customer**, by severity and by assignee, plus the full attention list |
| **SLA policies** | The targets and business-hours calendars — see [SLA policies and business hours](./sla-policies.md) |
Every alert and case page shows its own clocks in the **Service level** panel: time used against the target, who stopped each clock, and whether it is waiting on the customer.
***
## How the figures are computed
* **Compliance = met ÷ (met + breached).** Items still running have no outcome yet and are left out of both sides. "No outcome yet" shows as **—**, never as 0% or 100%.
* **Times are medians.** One bulk close of old noise can move an average by days; the median does not. The mean and the 90th percentile are shown next to it for the tail.
* **"Past SLA now"** counts open items whose clock has run out *and is still running*. A late acknowledgement stays a breach in the compliance figures, but it is not something to chase anymore.
* **Every tab is one snapshot.** All tabs, the attention list and the PDF report are computed together, so they never disagree.
* **Items opened before SLA tracking began** (the upgrade that introduced this page) count in volumes and in the backlog, but in no time or compliance figure — a banner says from when tracking runs.
***
## Filters
At the top: the **period** (24 hours, 7, 30 or 90 days, or a custom range), **customers**, **severities** and **sources**. Filters and the current tab live in the URL, so a link you share opens the same view.
You only ever see what your access allows: customer assignments and tag-based access apply exactly as in the alert and case lists.
***
## Tabs
| Tab | What it shows |
| - | - |
| **Overview** | The headline: SLA compliance, volumes opened/resolved with the change against the previous period, median times, past SLA now, false-positive rate, the volume trend and the items that need attention |
| **SLA** | Response and resolution compliance per severity, target against actual, and resolution compliance over time |
| **Analysts** | Per analyst: items acknowledged and resolved, their times, SLA kept, current load. **Admins see every analyst; an analyst sees only their own row.** |
| **Detection rules** | The rules producing alerts, how many became cases, how many were false positives — noisy rules are flagged for tuning |
| **Customers** | Per customer: volumes, backlog, past SLA, times and compliance |
| **Workload** | The live backlog: open, unassigned (and since when), at risk, past SLA, **waiting on customer**, by severity and by assignee, plus the full attention list |
| **SLA policies** | The targets and business-hours calendars — see [SLA policies and business hours](./sla-policies.md) |
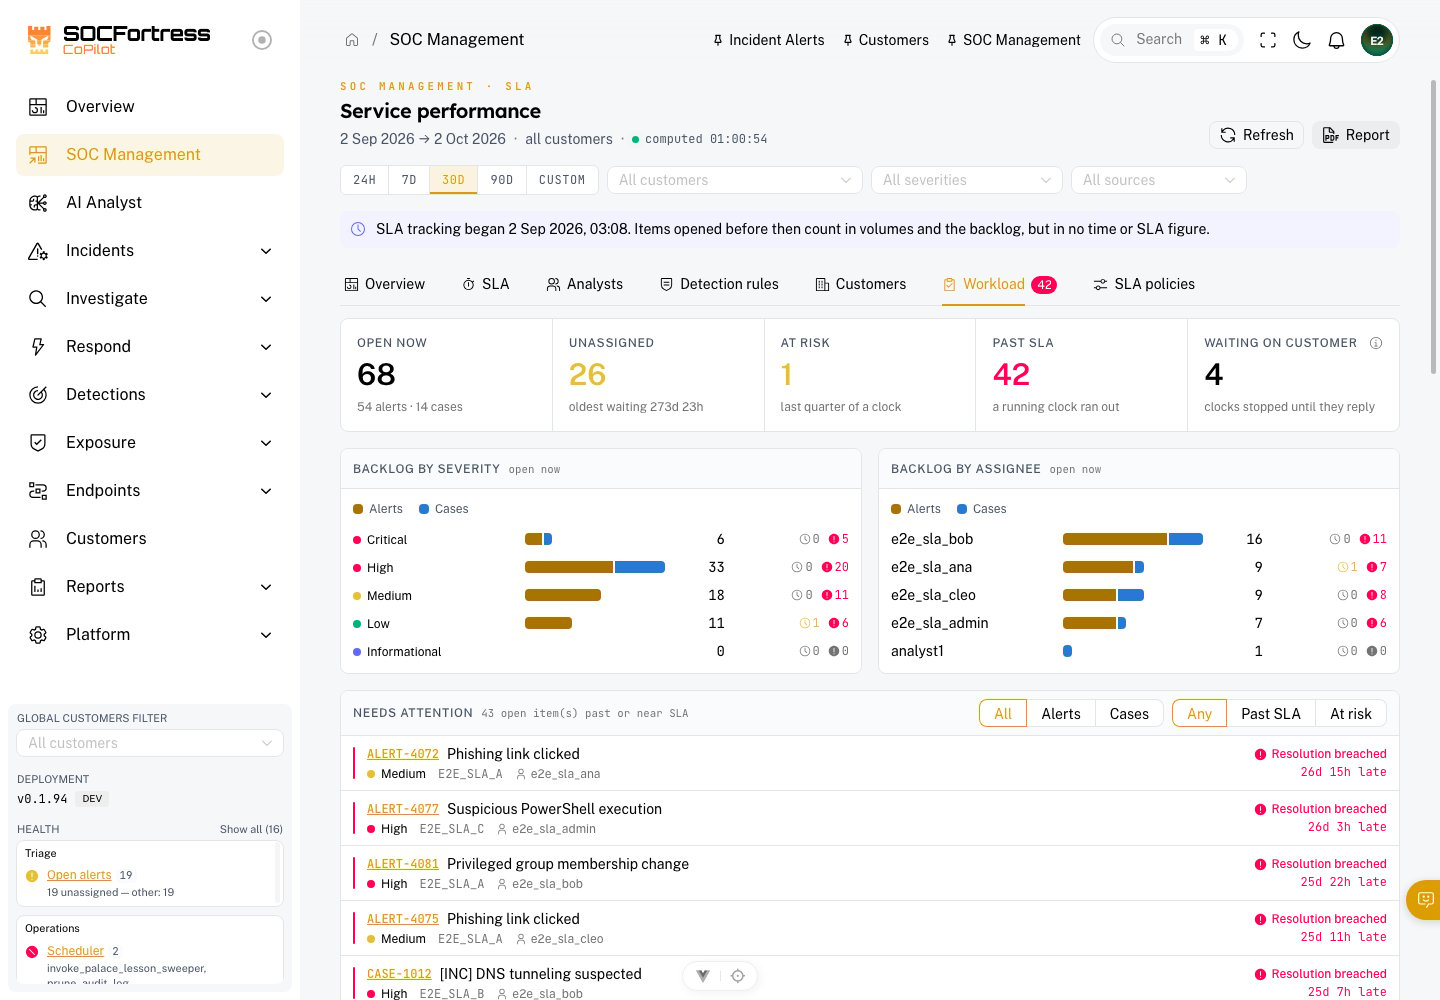 **At risk** means a running clock has entered the last quarter of its window. On a business-hours target that quarter is measured in working time, so a target due on Monday morning is not "at risk" all weekend.
***
## The PDF report
**Report** (top right) downloads the SOC operations report for the current filters: the same figures as the page, ready to share with management.
SLA figures can also go to a customer, in two ways the SOC controls:
* the **Service Level Performance** section of a customer incident report (*Customers → (customer) → Reporting*, option **SLA performance**) — never with analyst names;
* the customer's own **Service Levels** page in the Customer Portal, switched on per customer — see [Customer Portal — Service Levels](./customer-portal-service-levels.md).
***
## Being told before it is too late
Two notification triggers, **An alert or case SLA is at risk** and **An alert or case SLA is breached**, send a message once per clock to an internal route (Teams, email to the assignee, a webhook…). See [Notifications](./notifications.md).
***
## Related pages
* SLA policies and business hours: ./sla-policies.md
* Incident Alerts: ./incident-alerts.md
* Incident Cases: ./incident-cases.md
* Notifications: ./notifications.md
* Customer Portal — Service Levels: ./customer-portal-service-levels.md
This documentation is built and hosted on [Mintlify](https://mintlify.com), a developer documentation platform.
**At risk** means a running clock has entered the last quarter of its window. On a business-hours target that quarter is measured in working time, so a target due on Monday morning is not "at risk" all weekend.
***
## The PDF report
**Report** (top right) downloads the SOC operations report for the current filters: the same figures as the page, ready to share with management.
SLA figures can also go to a customer, in two ways the SOC controls:
* the **Service Level Performance** section of a customer incident report (*Customers → (customer) → Reporting*, option **SLA performance**) — never with analyst names;
* the customer's own **Service Levels** page in the Customer Portal, switched on per customer — see [Customer Portal — Service Levels](./customer-portal-service-levels.md).
***
## Being told before it is too late
Two notification triggers, **An alert or case SLA is at risk** and **An alert or case SLA is breached**, send a message once per clock to an internal route (Teams, email to the assignee, a webhook…). See [Notifications](./notifications.md).
***
## Related pages
* SLA policies and business hours: ./sla-policies.md
* Incident Alerts: ./incident-alerts.md
* Incident Cases: ./incident-cases.md
* Notifications: ./notifications.md
* Customer Portal — Service Levels: ./customer-portal-service-levels.md
This documentation is built and hosted on [Mintlify](https://mintlify.com), a developer documentation platform.