> ## Documentation Index
> Fetch the complete documentation index at: https://docs.socfortress.co/llms.txt
> Use this file to discover all available pages before exploring further.
# General reports (Grafana → PDF)
> Create PDF reports by snapshotting Grafana panels and combining them into a single document.
# General reports (Grafana → PDF)
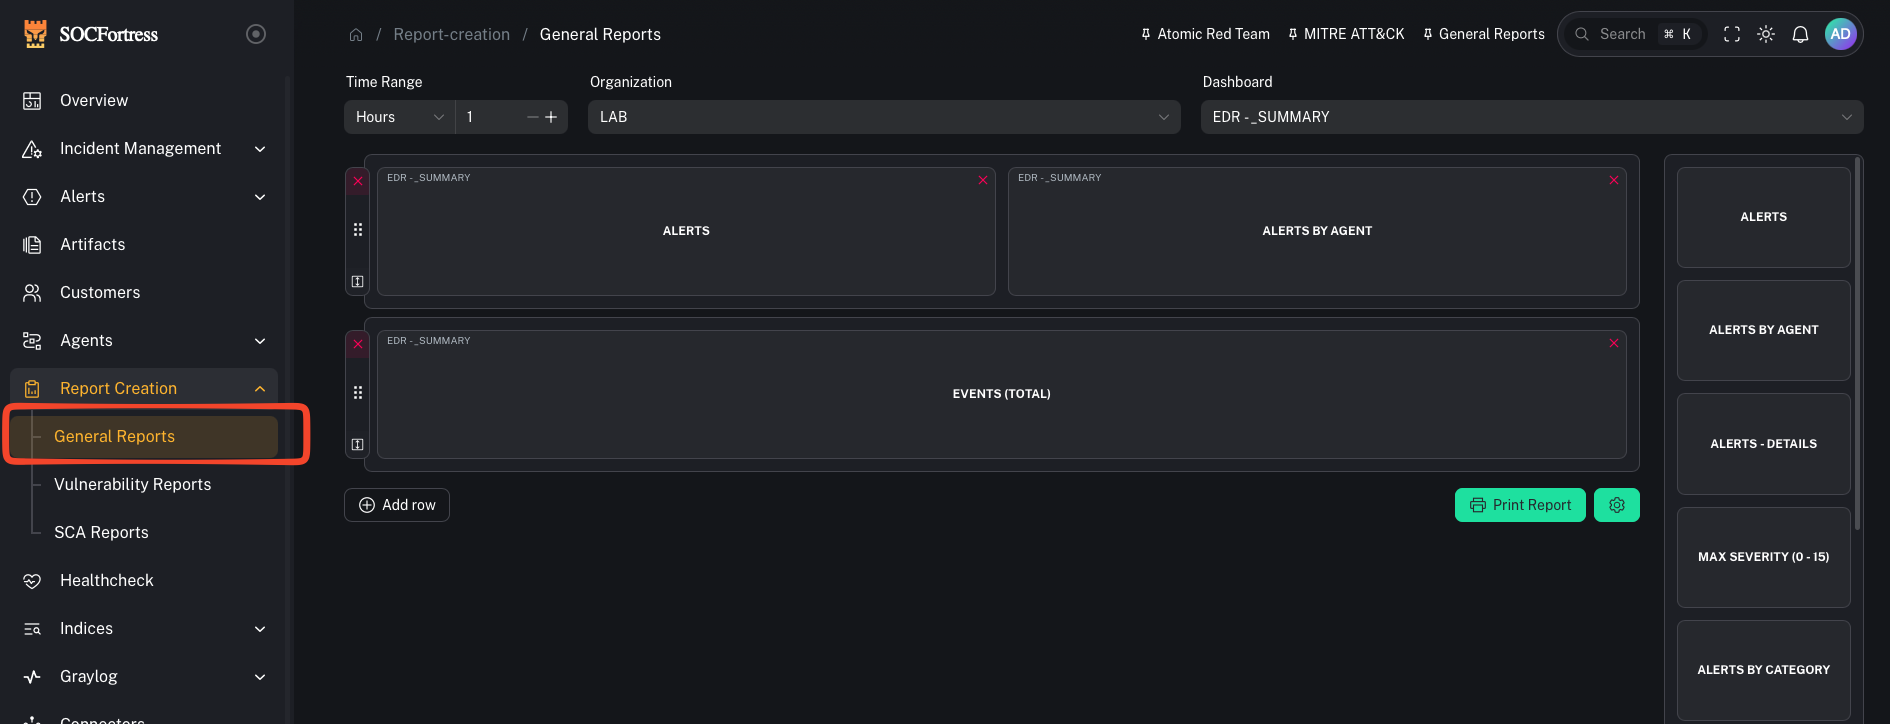
**Menu:** Report Creation → General Reports
General reports generate a PDF by taking snapshots of selected **Grafana dashboard panels**.
 ***
## What you need
* A Grafana org + dashboard you can access
* The panels you want to include
***
## Step 1 — Pick dashboard + time range
***
## What you need
* A Grafana org + dashboard you can access
* The panels you want to include
***
## Step 1 — Pick dashboard + time range
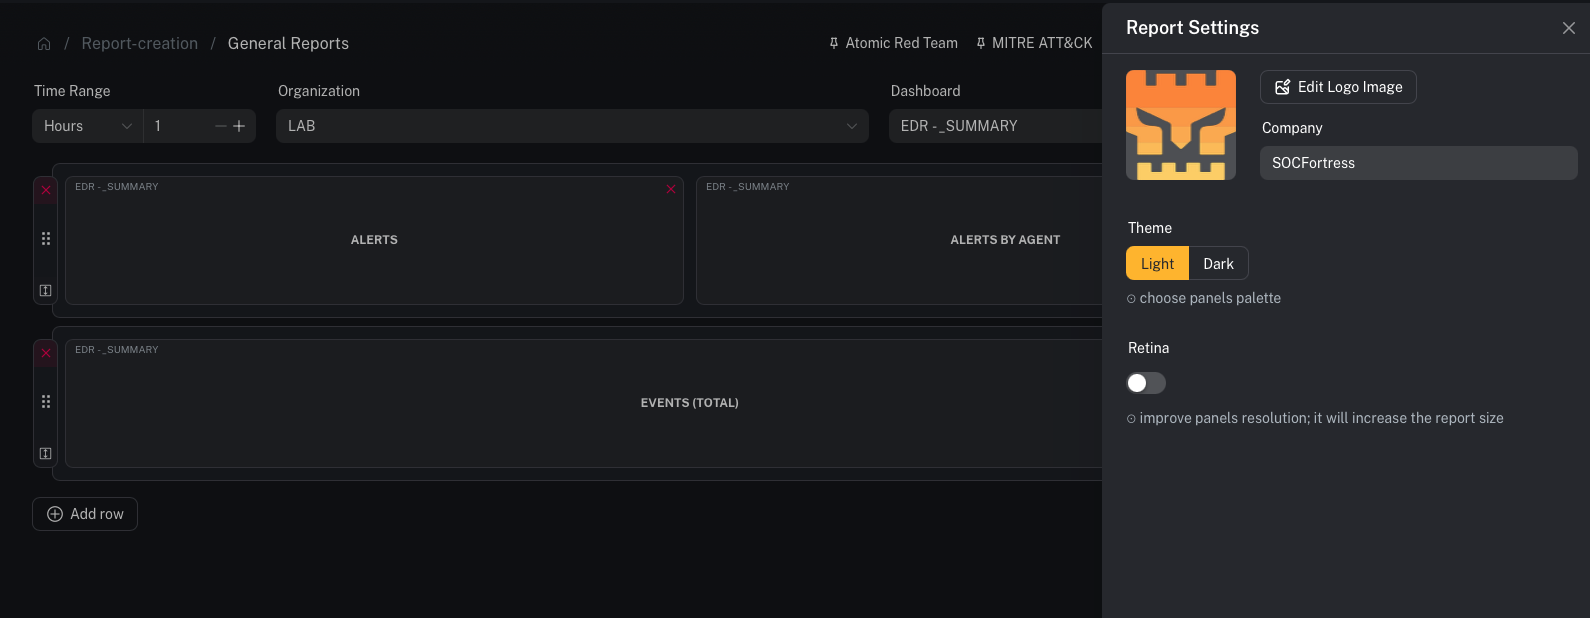 1. Open **Report Creation → General Reports**
2. Select the **Organization**
3. Select the **Dashboard**
4. Choose a **time range** (ex: `24h`, `7d`, `30d`)
***
## Step 2 — Select panels to include
1. Open **Report Creation → General Reports**
2. Select the **Organization**
3. Select the **Dashboard**
4. Choose a **time range** (ex: `24h`, `7d`, `30d`)
***
## Step 2 — Select panels to include
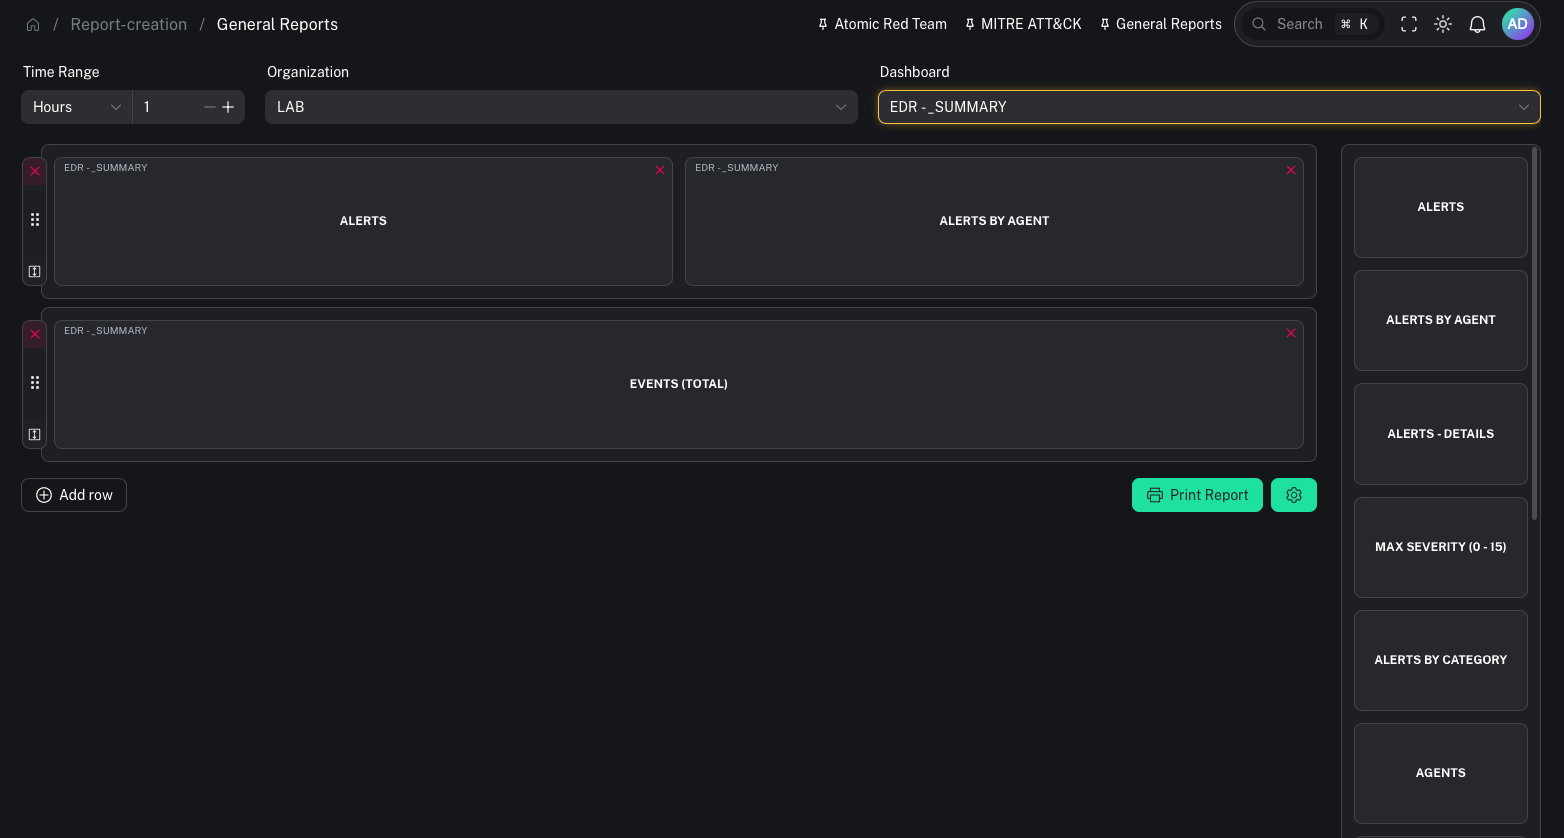 1. Pick the panels you want in the report
2. Arrange/confirm the selection
***
## Step 3 — Generate the PDF
When you generate the report, CoPilot will:
* create secure iframe links for the selected panels
* capture panel images
* assemble a PDF
Operator tips:
* Keep reports focused: pick 6–12 panels rather than trying to include everything.
* Use consistent time ranges so reports are comparable week-to-week.
***
## Common gotchas
### “This only works on desktop”
General report generation is desktop-oriented (panel selection/layout).
### “Panels are blank / missing data”
Usually a Grafana permissions or time range issue.
1. Pick the panels you want in the report
2. Arrange/confirm the selection
***
## Step 3 — Generate the PDF
When you generate the report, CoPilot will:
* create secure iframe links for the selected panels
* capture panel images
* assemble a PDF
Operator tips:
* Keep reports focused: pick 6–12 panels rather than trying to include everything.
* Use consistent time ranges so reports are comparable week-to-week.
***
## Common gotchas
### “This only works on desktop”
General report generation is desktop-oriented (panel selection/layout).
### “Panels are blank / missing data”
Usually a Grafana permissions or time range issue.